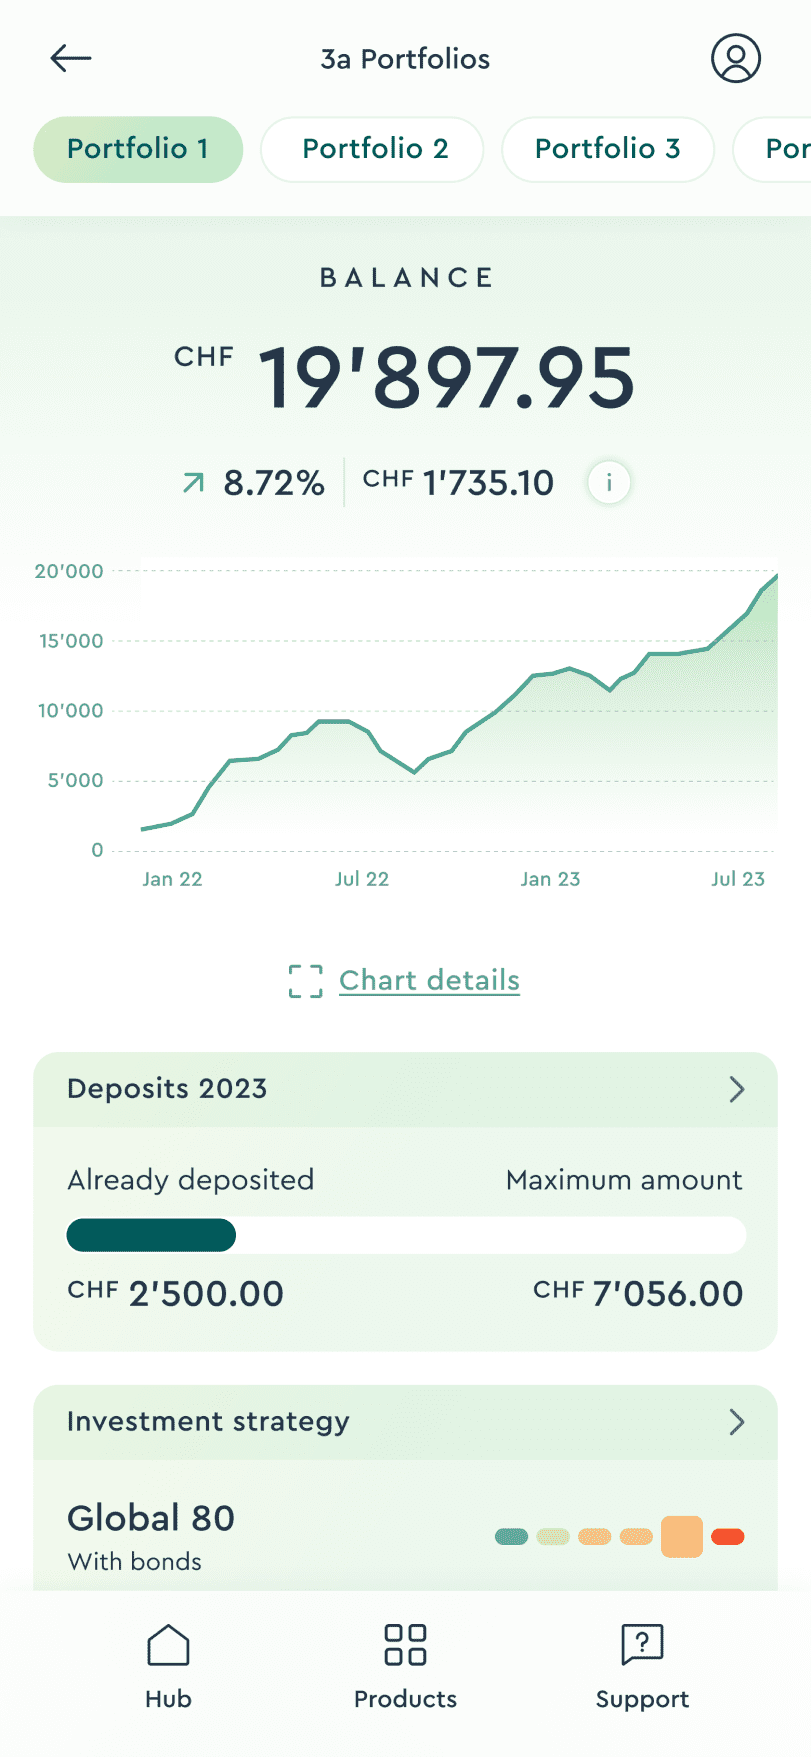
Yes, we allow you to manage up to 5 portfolios. You can add a second portfolio within seconds directly in the app. This allows you to make a staggered withdrawal as you get older. By withdrawing smaller amounts over several years, taxes can be saved (tax progression).
Provide for a relaxed future: With VIAC 3a.
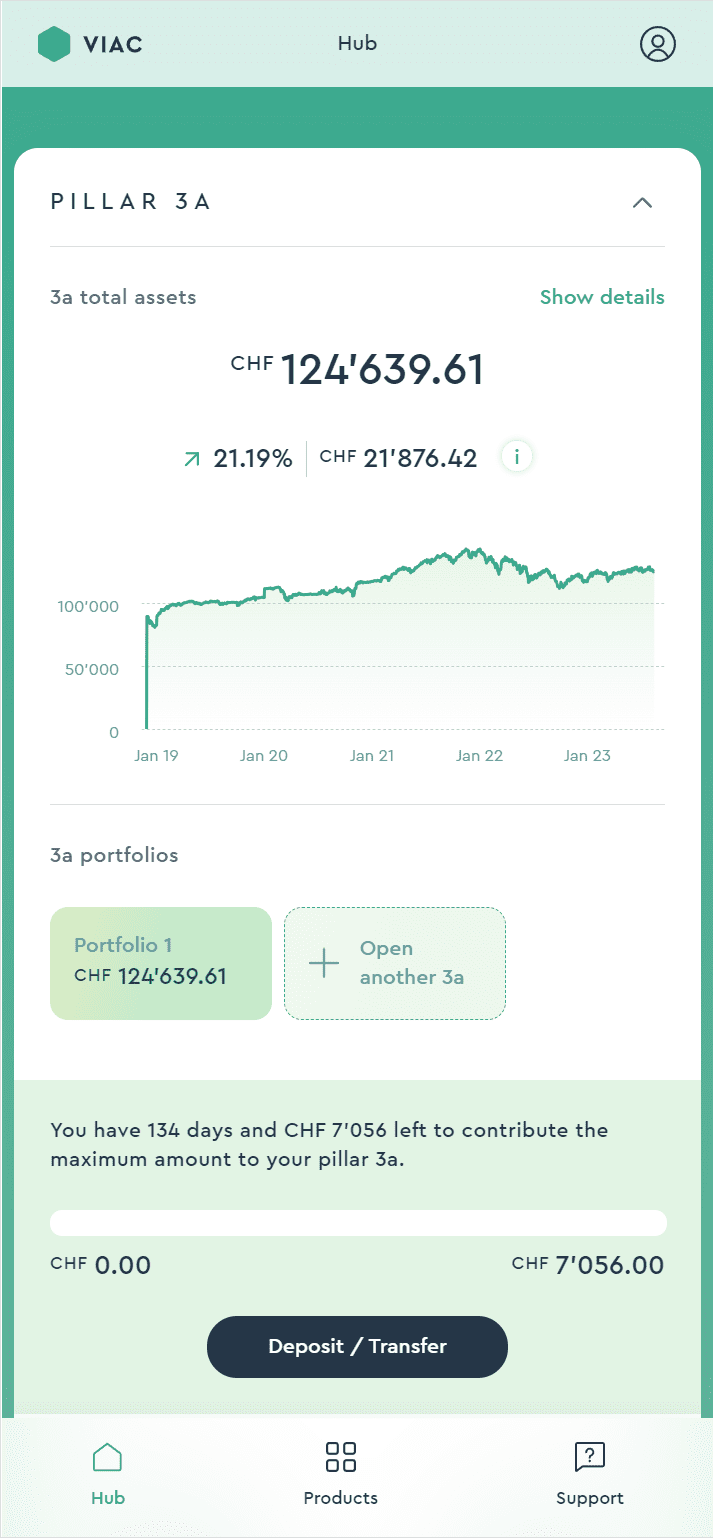
Pillar 3a Overview
The VIAC Pillar 3a
VIAC offers you the lowest costs – on average 65% lower than comparable offers – while at the same time providing maximum performance. One administration fee covers all transactions, custody account management and foundation administration – no matter how often or how much you deposit or adjust your strategy.
Pension calculator
Performance:
- good
- medium
- poor
Note
This overview is based on historical and representative index data of the last 15 years. The values shown represent the displayed strategy after deducting our administration fee and the corresponding product costs.
The three lines show poor (5%-quantile/yellow), medium (50%-quantile/black) and good (95%-quantile/green) performance. There is a low probability of performance lying outside these lines - these cases are represented by the lighter areas (1% and 99%-quantiles).
Past performance is no guarantee of future performance. Actual returns can deviate significantly from estimates
A pillar 3a solution that creates added value for the customer – not just for the bank.

Saving made easy
Our pension solution pays off, and is easy to use and understandable for everyone.

Start off with as little as CHF 1
Invest as much as you want and when you want – with no minimum deposit, minimum fee or minimum term.

Automatic monitoring
Constant ups and downs on the financial markets can lead to significant fluctuations in value. We constantly monitor your pillar 3 to keep your risk at the desired level.

Free Life Basic protection
For every CHF 10’000 of assets invested in securities, VIAC will provide you with free base protection coverage of CHF 2’500 in the event of death or disability.
Your advantages
A simple way to save taxes. Open a pillar 3 VIAC account with minimum effort.

Maximum flexibility
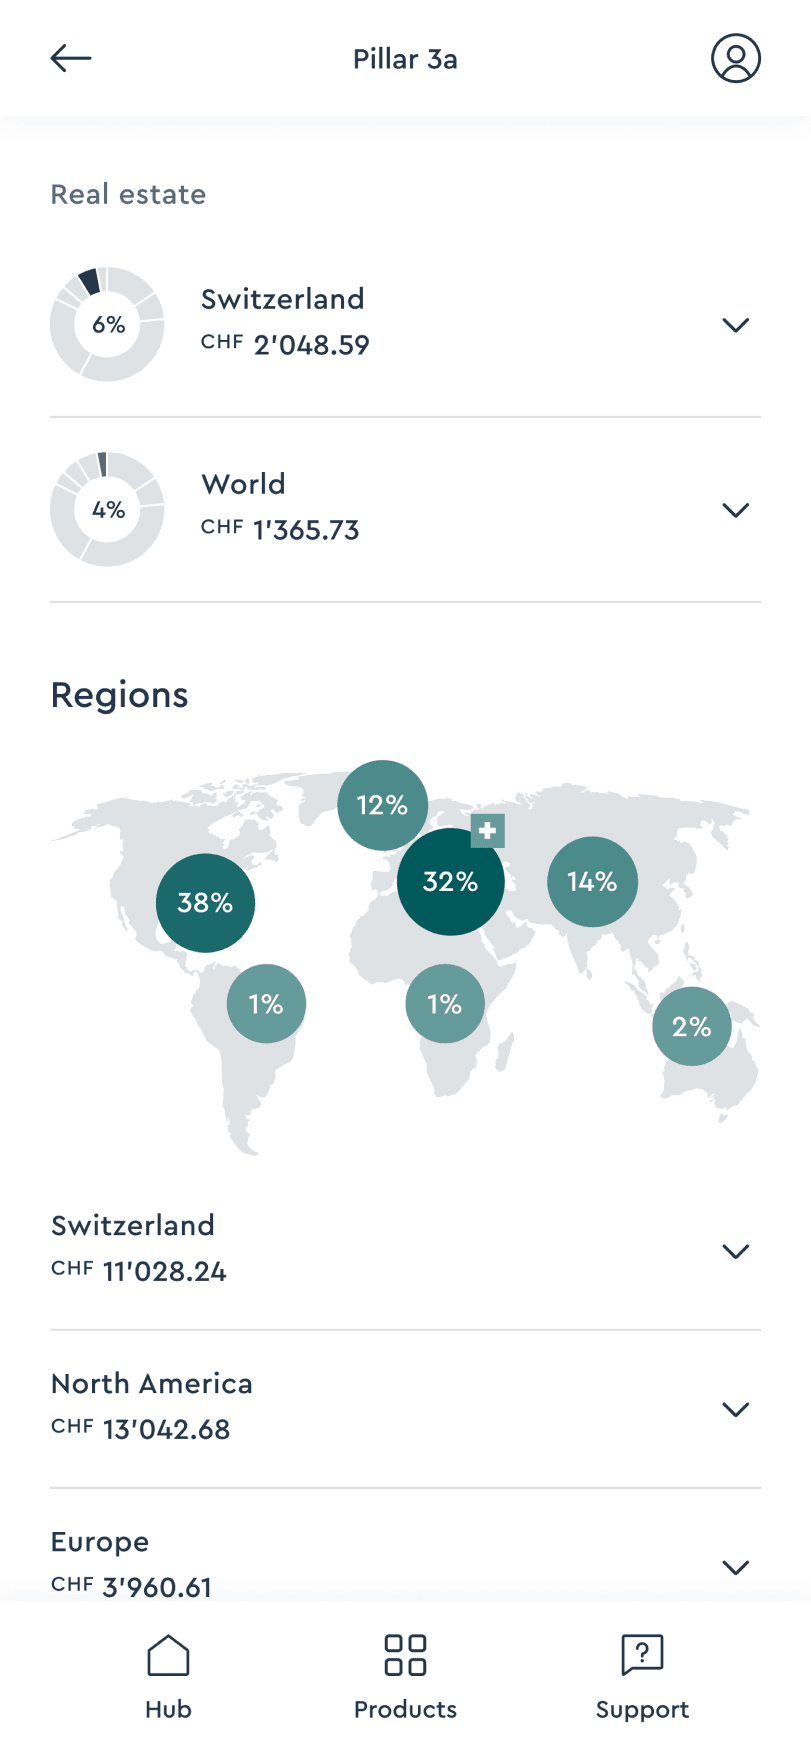
From an interest-bearing account up to 99% in equities, broadly diversified with index funds. You can adjust your investment strategy at any time – at no extra cost from VIAC.

100% digital pillar 3a
Open your personal pillar 3 within a few minutes on your smartphone – no matter when and where.
Maximum security
Your money is safe at the Terzo Pension Foundation of WIR Bank. WIR Bank is a purely Swiss, cooperative bank.

Experts help
Our pension and financial experts are happy to assist you with questions concerning the pillar 3a or securities-based saving. Just use our Chat – or simply call us.
Um das etwas verstaubte Image der freiwilligen Altersvorsorge aufzupolieren, haben Banken und Fintech-Unternehmen moderne 3a-App-Lösungen lanciert. Der Pionier und Marktführer auf diesem Gebiet ist Viac, der bereits 2017 eine Vorsorge-App lanciert hat.

Die Nutzerführung von Viac ist vorbildlich. Der Kontoeröffnungsprozess ist schlank und einfach zu bedienen

Mit dem neuen Angebot von Viac können 3a-Sparer ihr Vorsorgegeld voll in Aktien investieren. Ein Vergleich zeigt: Langfristig rentiert das besser als andere 3a-Wertschriften-Lösungen. So tiefe Gesamtkosten sind zurzeit unschlagbar.

Fintech macht es möglich: Junge Unternehmen dringen in immer weitere Bereich der Finanzdienstleistungen vor und machen arrivierten Anbietern Konkurrenz.

Das Jungunternehmen VIAC arbeitet mit der Vorsorgestiftung der WIR-Bank zusammen und fordert die etablierten Banken mit tiefen Gebühren heraus

Ein Vergleich zeigt: Ein 3a-Konto per App kann massiv Gebühren sparen.
Das Modell von Viac könnte Nachahmer finden und den Wettbewerb in der Säule 3a ankurbeln

Gebühren und Kosten werden transparent ausgewiesen und auch erklärt. Dazu kommt, dass Viac im Vergleich mit sehr tiefen Gebühren überzeugt.
Eine kostengünstige Anwendung für Smartphones erleichtert Kunden das Sparen mittels der Säule 3a.
Wer Geld fürs Alter sparen will, kann in die Säule 3a einzahlen. Um die Möglichkeit, dieses 3a-Geld nicht einfach in bar auf einem Konto zu deponieren, sondern in Aktien anzulegen, gibt es nun eine App.
Your trust – our most valuable asset.
VIAC Pillar 3a is a product of the Terzo Pension Foundation of WIR Bank.
The Terzo Pension Foundation of WIR Bank manages over 3 billion Swiss francs of existing 3a assets for its clients.
Money not invested in securities is held by WIR Bank. Thanks to the bankruptcy privilege of up to CHF 100’000, cash assets are treated preferentially in the event of insolvency of the account-holding bank.
Interest
0.20%
If you choose the fund provider UBS, your securities units will be traded and held in custody at UBS. In the event of bankruptcy, they are considered special assets and do not fall into the bankruptcy estate.
If you choose the fund provider Swisscanto, your securities units will be traded and held in custody at Zurich Cantonal Bank (ZKB). In the event of bankruptcy, they are considered special assets and do not fall into the bankruptcy estate.